Warning Timeline
Category: Warnings · Widget ID: warning.timeline
What it shows
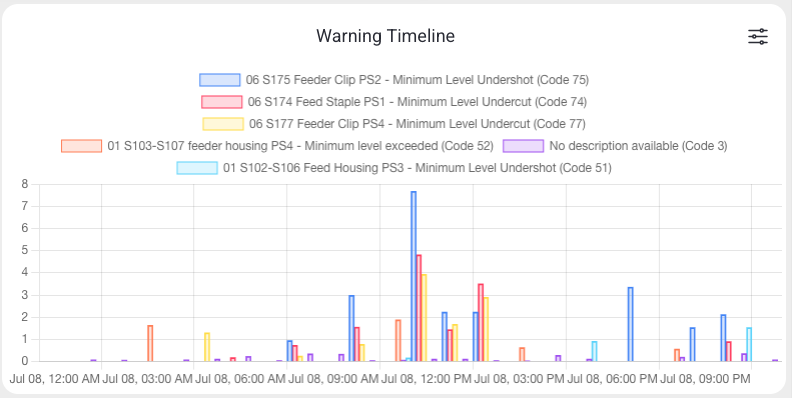
Aggregates warning durations across the selected period, so you can see total warning impact over time.
Data and refresh
- Data source: Reports API (time series).
- Time range: Respects the selected time period (plotted across the window).
- Machine filter: Respects the selected machine(s).
- Widget locks: You can lock this widget to its own machine and/or time range (Machine lock / Time lock) so it ignores the dashboard filters. See Custom Dashboard.
Configuration
Open the slider menu, then select Configure. Apply with Confirm or discard with Close.
| Setting | Choices and default | Effect |
|---|---|---|
| Show legend | On by default | Identifies the message series. |
| Time interval | 5m, 15m, 1h (default), 1d, 1w, 1mo | Groups the period into 5-minute, 15-minute, hourly, daily, weekly or monthly intervals. |
| Series mode | Split by message (default), Aggregate messages | Shows separate message series or combines the selected messages. |
| Selected messages only | All messages by default; Configure opens the message filter | Restricts the timeline to selected machine/message-code pairs. |
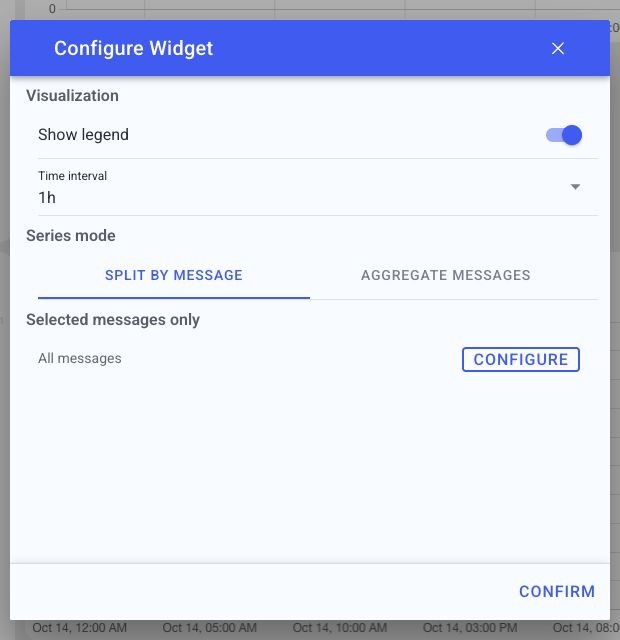
Use the message filter to search and select messages as described on the warning History page. Confirm the filter and then the parent dialog. This widget has no chart-type or Top N selector. Machine/time locks are in the widget menu.
How to read it
Bars/segments show warning duration per time bucket.
Interactions
- Widget filter (top-right icon) — open the widget's own settings to change its display.
Screenshot
Troubleshooting
Widget shows no data -> No events in the selected machine/period, or a filter is too narrow -> Widen the time range or change the machine, then refresh once -> If a machine that normally reports data stays empty, use Troubleshooting > Connectivity.