Process Metrics (Aggregate)
Category: Process Metrics · Widget ID: process-metrics.aggregate
What it shows
Shows aggregated process metrics for the selected period with configurable grouping — a summarized view of custom machine signals.
Data and refresh
- Data source: Reports API.
- Time range: Respects the selected time period (aggregated over the whole window).
- Machine filter: Respects the selected machine(s).
- Widget locks: You can lock this widget to its own machine and/or time range (Machine lock / Time lock) so it ignores the dashboard filters. See Custom Dashboard.
Configuration
Open the slider menu, then select Configure. A new widget also offers Configure in its empty state. Apply with Confirm or discard with Close.
| Setting | Choices and default | Effect |
|---|---|---|
| Metrics and Search | No metrics selected initially | Search sub-types, expand a metric group and select metrics. Select all/Deselect all applies to visible search results where multiple selection is allowed. |
| Group by | Machine + metric (default), Machine, Metric | Produces rows per machine/metric pair, per machine, or per metric across machines. Machine requires exactly one metric and reduces a multi-selection to one. |
| Aggregation | Sum (default), Average, Minimum, Maximum | Calculates the value over the selected period. A previously saved Count setting is shown only when that setting is already active. |
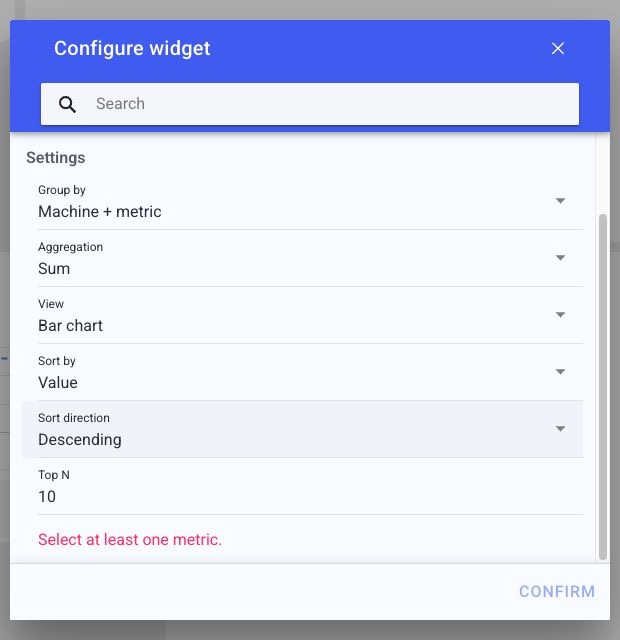
| View | Table (default), Bar chart, Number | Shows rows, a comparison chart or numeric values. |
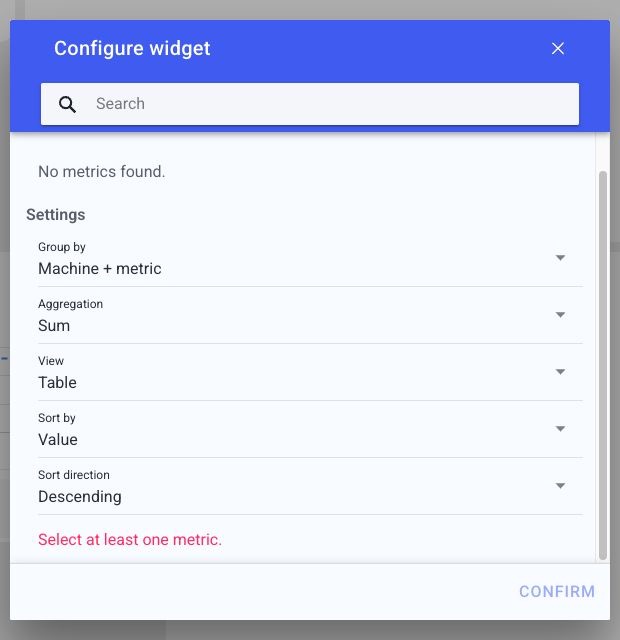
| Sort by | Value (default), Machine name, Metric | Orders results. Machine name is offered for groupings containing a machine; Metric is offered for groupings containing a metric. |
| Sort direction | Descending (default), Ascending | Controls the order of results. |
| Top N | 1-100, default 10 | Available only in Bar view; limits the displayed results. |
Confirm requires at least one metric and valid settings.
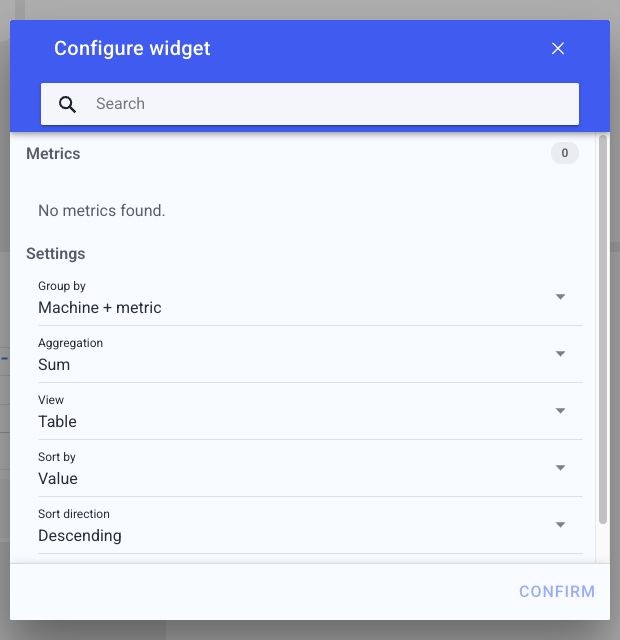
Scroll within the dialog to reach the sorting and validation fields:
Bar chart view adds the Top N field:
The example has no available metrics yet. Choices depend on the data reported for the selected machines. Machine/time locks are in the widget menu.
How to read it
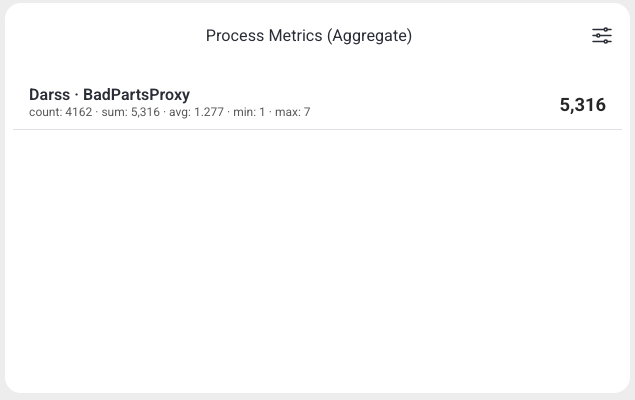
Each bar/row is the aggregated value of a metric for the period. Use it for at-a-glance comparison across machines or sub-types.
Interactions
- Widget filter (top-right icon) — open the widget's own settings to change its display.
Screenshot
Troubleshooting
Widget shows no data -> No events in the selected machine/period, or a filter is too narrow -> Widen the time range or change the machine, then refresh once -> If a machine that normally reports data stays empty, use Troubleshooting > Connectivity.