Produced Parts Over Time
Category: Performance Metrics · Widget ID: oee.parts-timeseries
What it shows
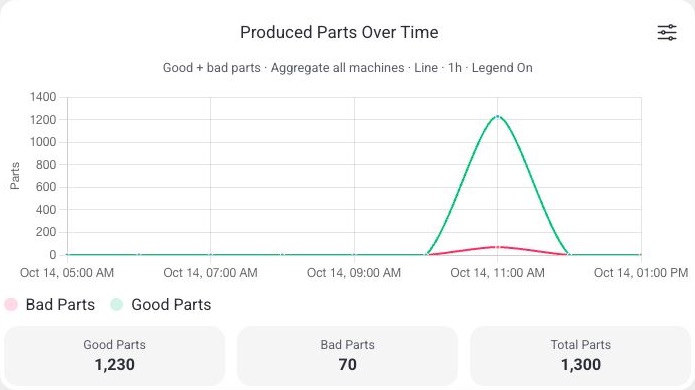
Shows produced good and bad parts over time using the Reports API, so you can see production volume and its trend across the window.
Data and refresh
- Data source: Reports API (time series).
- Time range: Respects the selected time period (plotted across the window).
- Machine filter: Respects the selected machine(s).
- Widget locks: You can lock this widget to its own machine and/or time range (Machine lock / Time lock) so it ignores the dashboard filters. See Custom Dashboard.
Configuration
Open the slider menu, then select Configure. Apply with Confirm or discard with Close.
| Setting | Choices and default | Effect |
|---|---|---|
| Chart type | Line (default), Bar, Stacked bar | Draws trends, separate bars, or stacked good/bad parts for each time bucket. Stacked bar requires Good + bad parts; selecting only one part type switches it to Bar. |
| Series mode | Good + bad parts (default), Good parts only, Bad parts only | Chooses which part counts appear. |
| Machine series | Aggregate all machines (default), Split by machine | Combines the selected machines or gives each machine its own series. |
| Bucket | 5m, 15m, 1h (default), 1d, 1w, 1mo | Groups counts into 5-minute, 15-minute, hourly, daily, weekly or monthly intervals. |
| Show legend | On by default | Shows the key identifying each series. |
| Show totals | On by default | Shows good, bad and total part counts below the chart. |
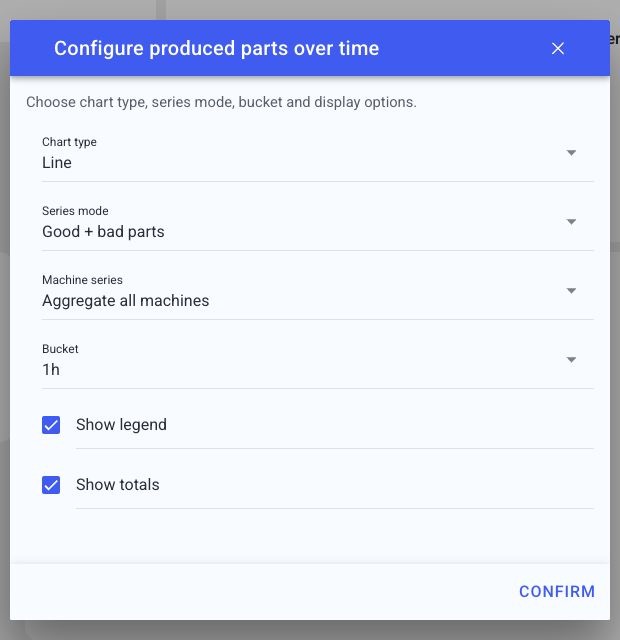
The bucket changes the grouping within the selected period, not the period itself. Machine/time locks are in the widget menu.
How to read it
Bars/lines per time bucket show how many parts were produced. Compare good vs bad series to spot quality drops.
Interactions
- Widget filter (top-right icon) — open the widget's own settings to change its display.
Screenshot
Troubleshooting
Widget shows no data -> No events in the selected machine/period, or a filter is too narrow -> Widen the time range or change the machine, then refresh once -> If a machine that normally reports data stays empty, use Troubleshooting > Connectivity.
See also (expected behaviour): why the parts-over-time total can differ from the Good/Bad Parts counter.