OEE
Category: Performance Metrics · Widget ID: oee.doughnut-oee
What it shows
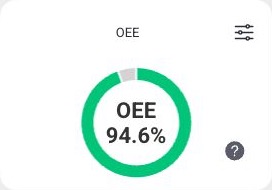
Shows the Overall Equipment Effectiveness (OEE) of the machine in the selected timeframe. OEE combines Availability, Performance, and Quality into one score.
Data and refresh
- Data source: OEE service (aggregated over the period).
- Time range: Respects the selected time period (aggregated over the whole window).
- Machine filter: Respects the selected machine(s).
- Widget locks: You can lock this widget to its own machine and/or time range (Machine lock / Time lock) so it ignores the dashboard filters. See Custom Dashboard.
Configuration
This widget has no separate display configuration dialog and no Configure action. Open its slider menu for these settings:
| Setting or action | Default | Effect |
|---|---|---|
| Lock machine | Off | Keeps the widget on its local machine selection instead of following the dashboard machine filter. |
| Choose machine | Dashboard selection while unlocked | Opens the machine selector; confirming also enables the machine lock. |
| Lock time range | Off | Keeps the widget on its local period instead of following the dashboard time filter. |
| Choose time | Dashboard period while unlocked | Opens the period/batch selector; confirming also enables the time lock. |
The shared widget menu and lock instructions include a screenshot. Use Info to read the metric definition.
How to read it
A ring with the value in the center as a percentage for the selected period. Tap the info/help control to see how the KPI is defined.
Interactions
- Help/info — view the KPI definition.
Screenshot
Troubleshooting
Widget shows no data -> No events in the selected machine/period, or a filter is too narrow -> Widen the time range or change the machine, then refresh once -> If a machine that normally reports data stays empty, use Troubleshooting > Connectivity.