Machine Alerts Live
Categories: Errors / Warnings · Widget ID: machine.alert-live
What it shows
Shows active errors and warnings in real time, independent of the selected time range — the live to-do list for the machine right now.
Data and refresh
- Data source: Live alerts stream (real-time).
- Time range: Live — always shows real-time data and ignores the selected time period and the dashboard refresh interval.
- Machine filter: Respects the selected machine(s).
- Widget locks: Lock machine keeps the widget on its local machine selection. Live widgets have no time lock or Choose time action. See Custom Dashboard.
Configuration
Open the slider menu, then select Configure. Apply with Confirm or discard with Close.
| Setting | Choices | Effect |
|---|---|---|
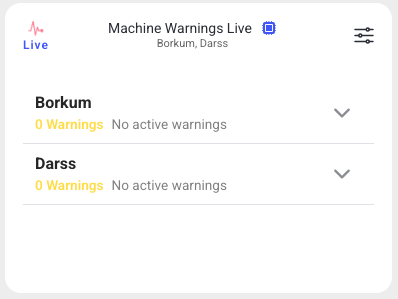
| Show | Errors and warnings, Errors only, Warnings only | Chooses the currently active message types. The catalog's Machine Errors Live entry starts with Errors only; Machine Warnings Live starts with Warnings only. Both are variants of the same widget. |
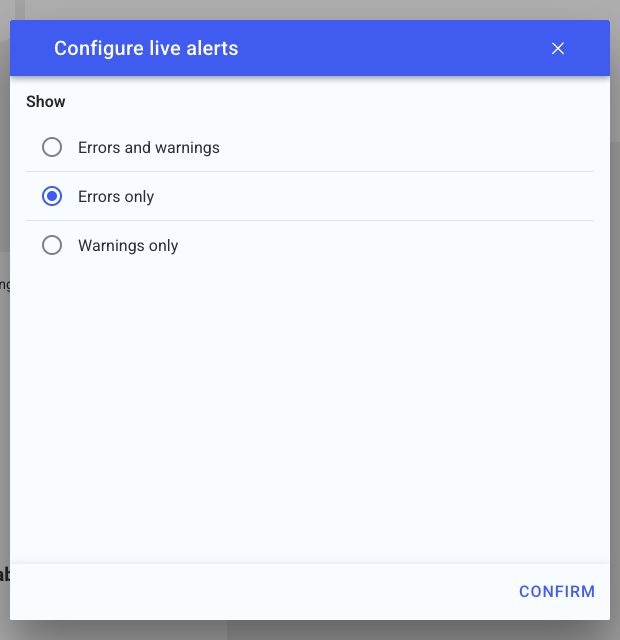
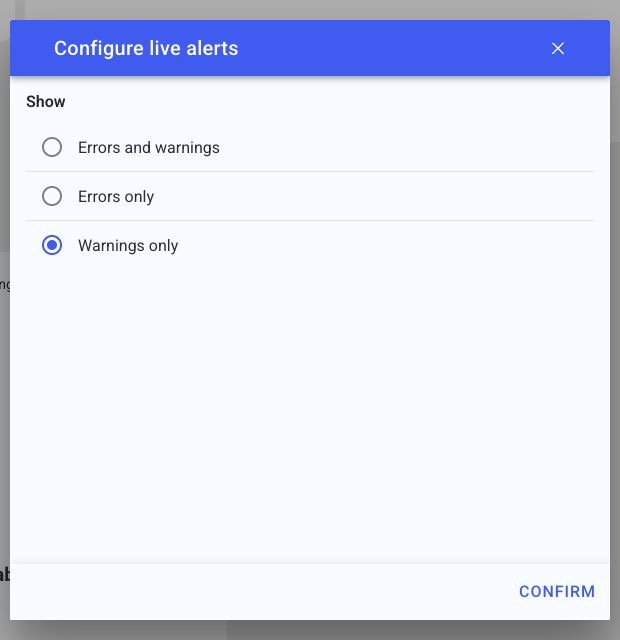
Use Choose machine and Lock machine in the widget menu for its machine selection. The message filter changes the live list; it does not acknowledge or clear machine errors. Historical periods and the dashboard refresh interval do not control this widget.
How to read it
A live list of currently active errors/warnings. Because it is live, it updates on its own and ignores the dashboard time filter.
Interactions
- Widget filter — choose alert scope.
- Updates automatically.
Screenshot
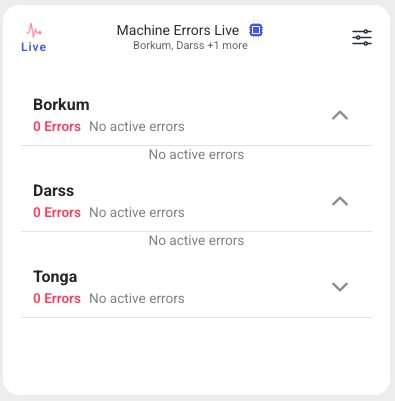
The same widget can be configured to show warnings instead:
Troubleshooting
Widget shows nothing -> No live connection or the machine is not reporting -> Confirm the machine is online -> If it stays empty, use Troubleshooting > Connectivity with the machine name.