Quality
Category: Performance Metrics · Widget ID: oee.doughnut-quality
What it shows
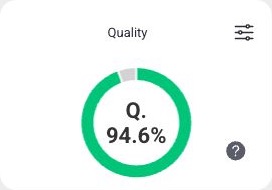
Shows the Quality (Q) produced by the machine in the selected timeframe — good parts versus total parts. It can also display the inverse scrap rate.
Data and refresh
- Data source: OEE service (aggregated over the period).
- Time range: Respects the selected time period (aggregated over the whole window).
- Machine filter: Respects the selected machine(s).
- Widget locks: You can lock this widget to its own machine and/or time range (Machine lock / Time lock) so it ignores the dashboard filters. See Custom Dashboard.
Configuration
Open the widget's slider menu, then select Configure. Select Confirm to apply the change, or Close to discard it.
| Setting | Choices and default | Effect |
|---|---|---|
| Display mode | Quality rate (default), Scrap rate | Quality rate shows the good-part share; Scrap rate shows the bad-part share. The displayed KPI and its help explanation change together. |
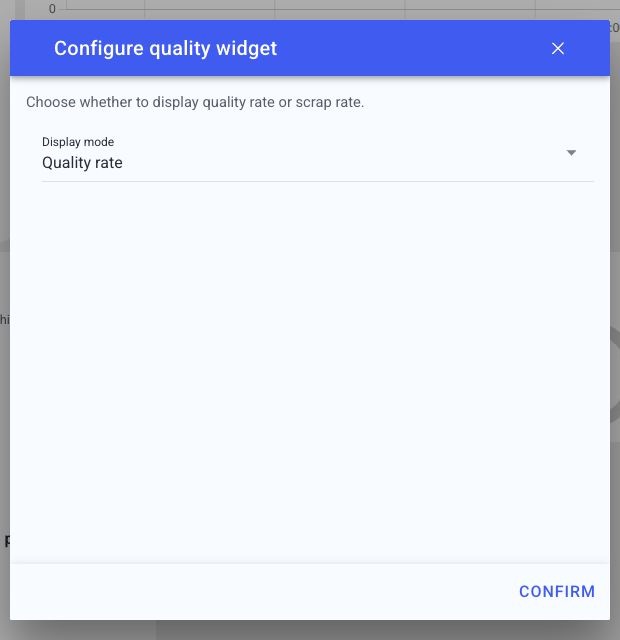
Machine/time locks are configured separately in the widget menu.
How to read it
A ring with the value in the center as a percentage for the selected period. Tap the info/help control to see how the KPI is defined. Switch the display mode to show scrap rate instead of quality rate.
Interactions
- Display mode toggle (Quality rate / Scrap rate).
- Help/info — view the KPI definition.
Screenshot
Troubleshooting
Widget shows no data -> No events in the selected machine/period, or a filter is too narrow -> Widen the time range or change the machine, then refresh once -> If a machine that normally reports data stays empty, use Troubleshooting > Connectivity.