Scrap Analysis
Category: Scrap · Widget ID: scrap.pareto
What it shows
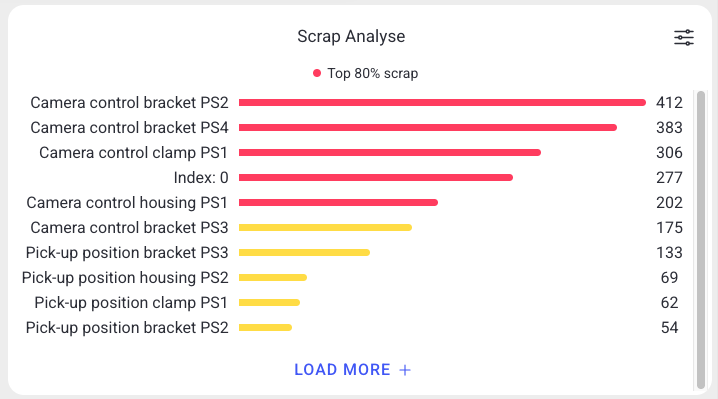
Analyzes and visualizes scrap reasons as a ranked (Pareto) breakdown, so you can see which reasons cause the most scrap.
Data and refresh
- Data source: Reports API.
- Time range: Respects the selected time period (aggregated over the whole window).
- Machine filter: Respects the selected machine(s).
- Widget locks: You can lock this widget to its own machine and/or time range (Machine lock / Time lock) so it ignores the dashboard filters. See Custom Dashboard.
Configuration
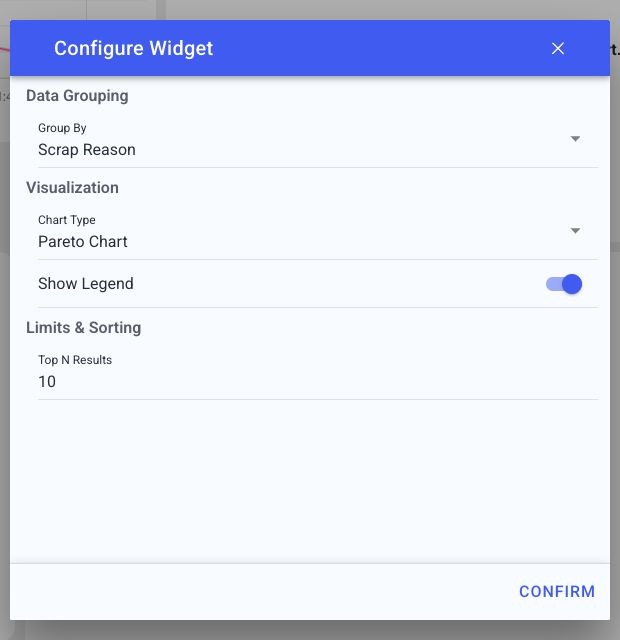
Open the slider menu, then select Configure. Apply with Confirm or discard with Close.
| Setting | Choices and default | Effect |
|---|---|---|
| Group By | Scrap Reason (default), Machine, Track, Station | Combines scrap counts by reason, machine, track or station. Track/station comparisons need those values in the machine's scrap configuration. |
| Chart Type | Pareto Chart (default), Bar Chart, Pie Chart, Doughnut Chart, Table | Chooses a ranked chart, share chart or table. |
| Show Legend | On by default | Identifies chart series; hidden for Table. |
| Top N Results | 1-25, default 10 | Limits the number of ranked groups displayed. Confirm is disabled for invalid values. |
Machine/time locks are in the widget menu.
How to read it
Reasons are ranked by scrap quantity, largest first. Focus improvement on the top contributors.
Interactions
- Load more — show additional scrap reasons.
- Widget filter (top-right icon) — open the widget's own settings to change its display.
Screenshot
Troubleshooting
Widget shows no data -> No events in the selected machine/period, or a filter is too narrow -> Widen the time range or change the machine, then refresh once -> If a machine that normally reports data stays empty, use Troubleshooting > Connectivity.