Process Metrics (Time Series)
Category: Process Metrics · Widget ID: process-metrics.timeseries
What it shows
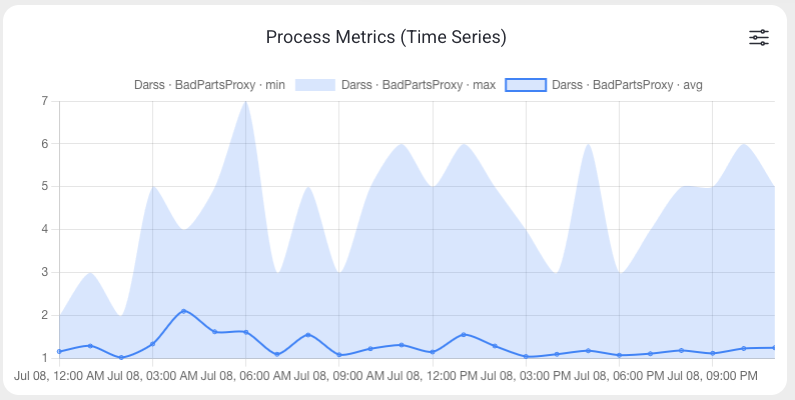
Shows one or more process metrics over time with configurable aggregation and grouping — for custom machine signals beyond the standard KPIs.
Data and refresh
- Data source: Reports API (time series).
- Time range: Respects the selected time period (plotted across the window).
- Machine filter: Respects the selected machine(s).
- Widget locks: You can lock this widget to its own machine and/or time range (Machine lock / Time lock) so it ignores the dashboard filters. See Custom Dashboard.
Configuration
Open the slider menu, then select Configure. A new widget also offers Configure in its empty state. Apply with Confirm or discard with Close.
| Setting | Choices and default | Effect |
|---|---|---|
| Metrics and Search | No metrics selected initially | Search metric sub-types, expand a metric group and select the required sub-types. Select all/Deselect all applies to visible search results where multiple selection is allowed. |
| Aggregation | Sum (default), Average, Minimum, Maximum | Calculates the selected value for each time bucket. |
| Show min/max | Off by default | Adds the minimum/maximum range to a Line chart. Disabled for Bar; changing to Bar switches this option off. |
| Resolution | 5m, 15m, 1h (default), 1d, 1w, 1mo | Uses 5-minute, 15-minute, hourly, daily, weekly or monthly intervals. |
| Group by | Machine + metric (default), Machine, Metric | Separates machine/metric pairs, machines, or metrics combined across machines. Machine requires exactly one selected metric; changing to Machine reduces a multi-selection to one. |
| Chart type | Line (default), Bar | Changes how aggregated values are drawn. |
| Show legend | On by default | Shows the key identifying the metric series. |
Confirm requires at least one metric. Machine + metric allows up to 500 machine/metric combinations; reduce the machine or metric selection if this limit is exceeded. The displayed series count helps assess the selection.
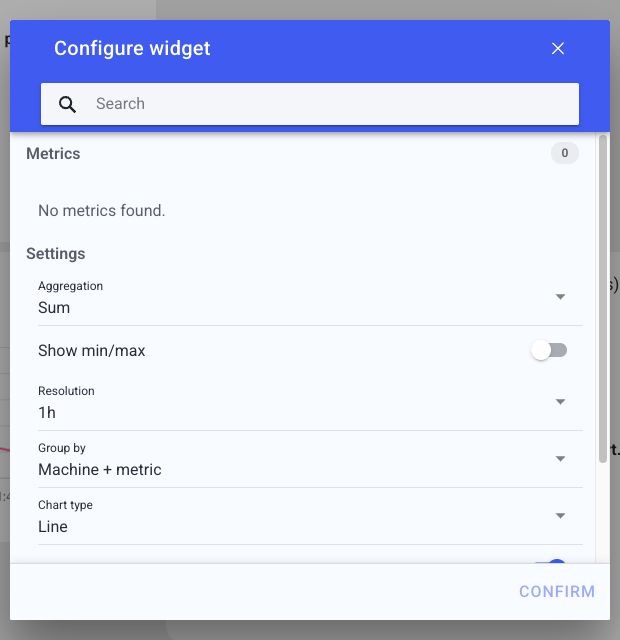
Scroll within the dialog to reach the remaining settings and validation message:
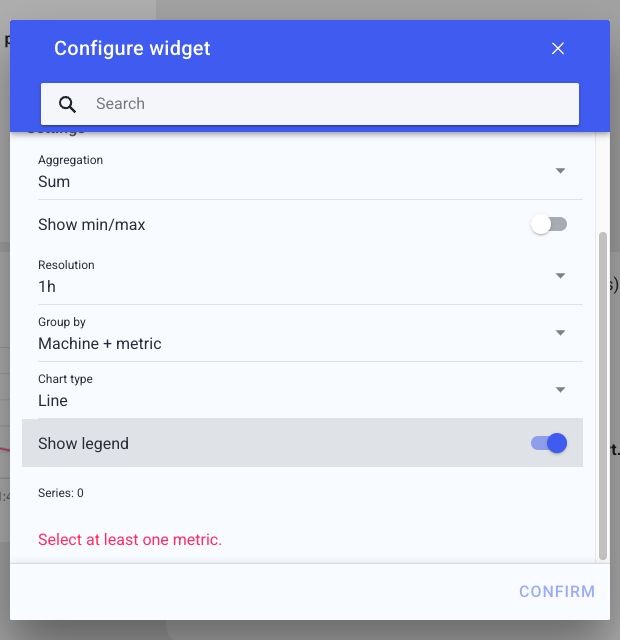
The example has no available metrics yet. Metric choices depend on the data reported for the selected machines. There is no Fill missing with zero control in this dialog. Machine/time locks are in the widget menu.
How to read it
Each series is a process metric over time. Grouping controls whether machines/sub-types are separate series.
Interactions
- Widget filter (top-right icon) — open the widget's own settings to change its display.
Screenshot
Troubleshooting
Widget shows no data -> No events in the selected machine/period, or a filter is too narrow -> Widen the time range or change the machine, then refresh once -> If a machine that normally reports data stays empty, use Troubleshooting > Connectivity.