Warning Pareto
Category: Warnings · Widget ID: warning.pareto
What it shows
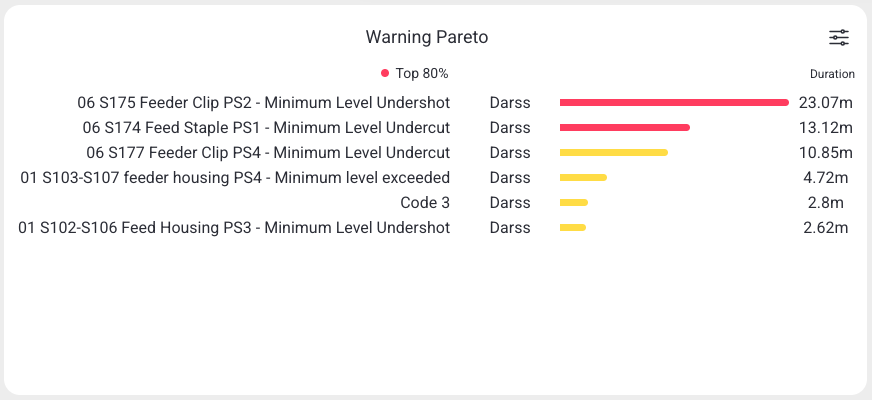
Highlights the most frequent or longest warnings in the selected period as a ranked (Pareto) list.
Data and refresh
- Data source: Reports API.
- Time range: Respects the selected time period (aggregated over the whole window).
- Machine filter: Respects the selected machine(s).
- Widget locks: You can lock this widget to its own machine and/or time range (Machine lock / Time lock) so it ignores the dashboard filters. See Custom Dashboard.
Configuration
Open the slider menu, then select Configure. Apply with Confirm or discard with Close.
| Setting | Choices and default | Effect |
|---|---|---|
| Chart Type | Pareto Chart (default), Bar Chart, Pie Chart, Doughnut Chart, Table | Chooses a ranked chart, a share chart or table. |
| Show Legend | On by default | Identifies chart series; hidden for Table. |
| Sort by | Duration (default), Quantity, ⌀ Duration | Ranks warnings by total duration, number of occurrences or average duration per occurrence. |
| Top N | 1-500, default 10 | Limits the displayed messages. Confirm requires a valid value. |
| Selected messages only | All messages by default; Configure opens the message filter | Restricts this widget to chosen machine/message-code pairs. |
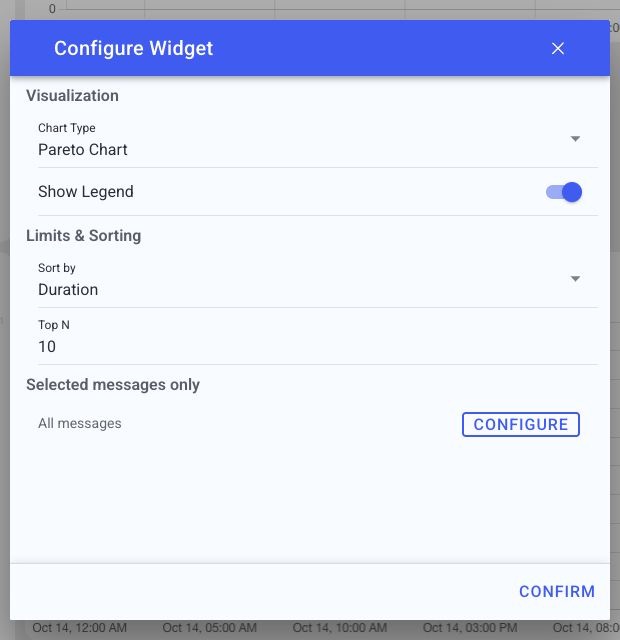
In the message filter, choose All messages or Selected messages only. Search for messages, select matching results, and review the selected-message list. Remove individual entries or use Deselect all to clear the list. Select Confirm in the filter, then Confirm in the parent configuration dialog to apply both changes. The filter affects this widget; it does not change the machine's ignored-message settings.
The same filter is illustrated on the warning History page. Machine/time locks are in the widget menu.
How to read it
Warnings are ranked by frequency or duration, largest first.
Interactions
- Analyze — open the message analysis popup for the selected message (see Analyze Message Popup).
- Help — open matching guidance suggestions for the message.
- Ignore — mark this message code as ignored for its machine (requires permission). This affects historical warning views beyond this widget; it is not a local display filter. See Ignore message behavior.
- Load more — load additional rows beyond the first page.
- Widget filter (top-right icon) — change top-N, message scope, and display.
Screenshot
Troubleshooting
Widget shows no data -> No events in the selected machine/period, or a filter is too narrow -> Widen the time range or change the machine, then refresh once -> If a machine that normally reports data stays empty, use Troubleshooting > Connectivity.